I have been working on websites for more than 15 years, and I’ve taught myself a great deal of content management through Googling for tips and tutorials. I consider myself fairly tech savvy when it comes to figuring out new software.
But NVivo has bested me.
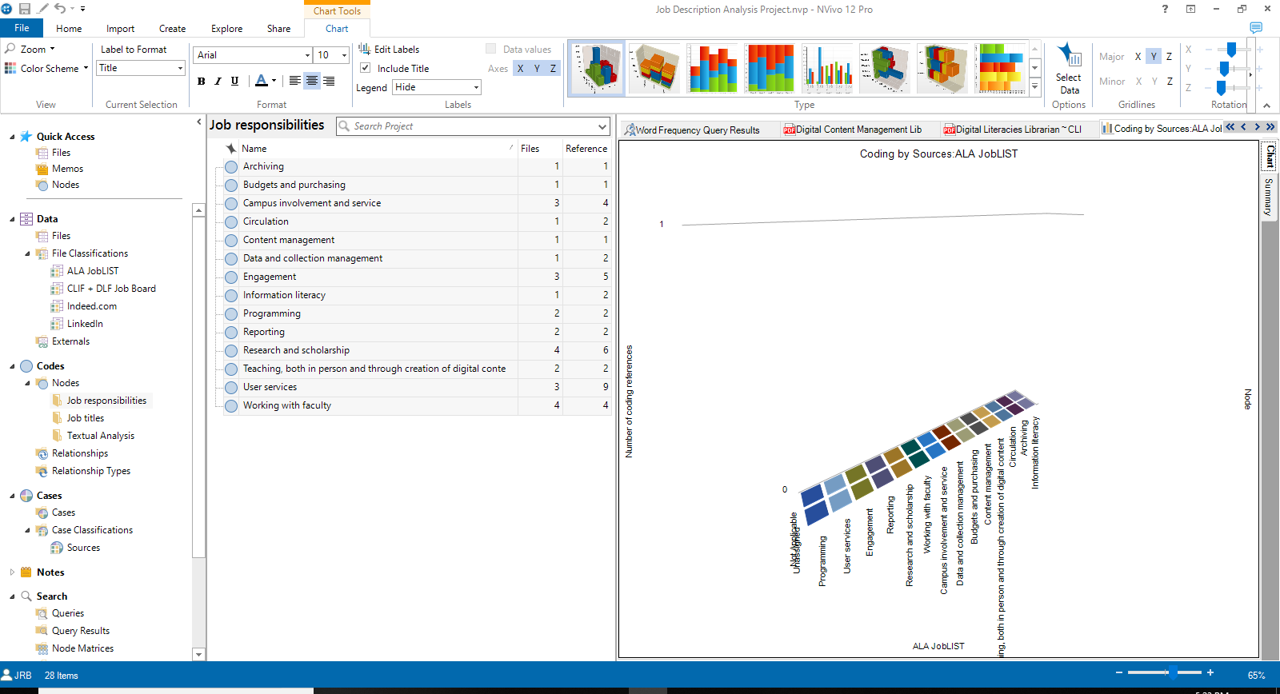
Our job description assignment for INFO 5000 required that we use NVivo software to create charts and infographics for a presentation analyzing several different job descriptions. I was able to learn how to mark text in the descriptions in order to track different phrases or skills. I thought creating the graphs would be a simple next step.

I was wrong.
I searched for tutorials. I asked my classmates. I asked my fellow interns at SMU (who also have completed this class at UNT). I found plenty of ways to mark and categorize information, and no guidance that led to the graphs I was envisioning in my head with multiple nodes. I worked on the project for nearly 12 hours, trying to create the desired graphics, without success. I woke up at 5 a.m. the next morning unable to get the project out of my head, and I continued to play with the settings for creating graphs.
No dice.
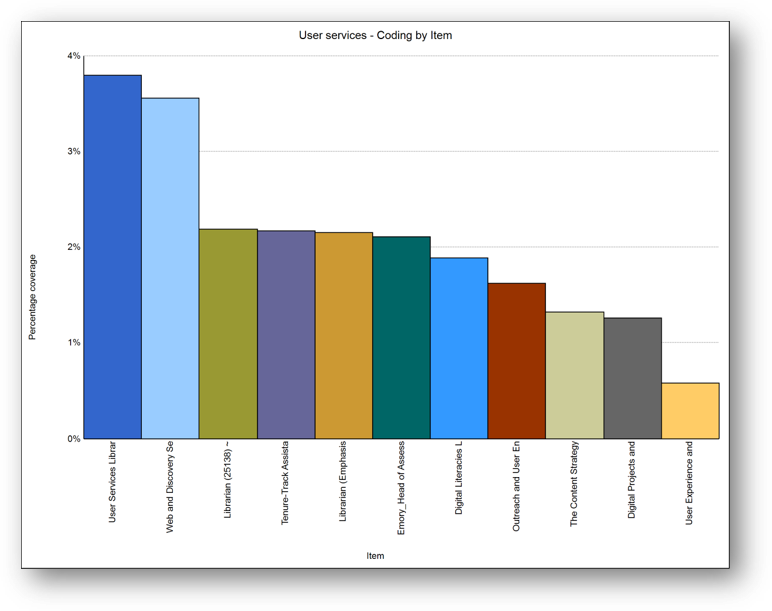
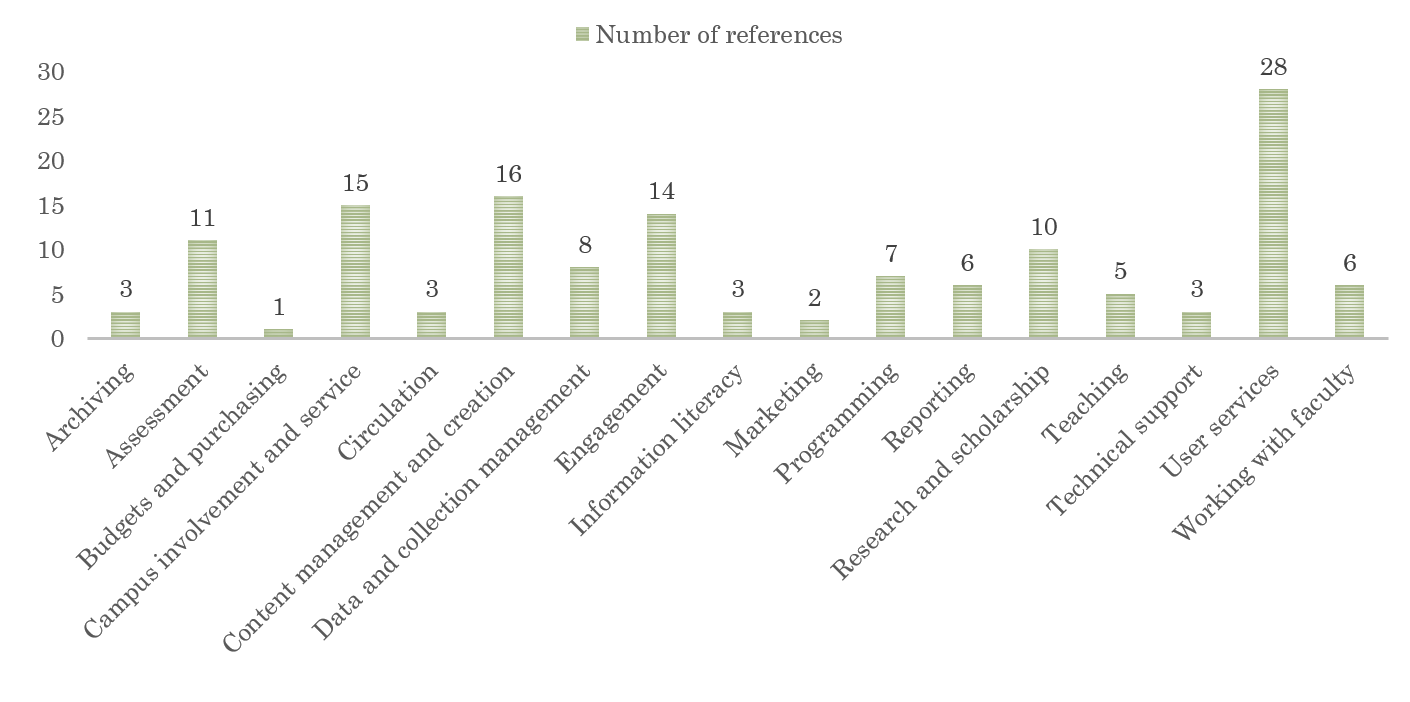
So I decided to step back and re-envision my data. If I couldn’t create the graphs I originally sought, there were other ways to create data visualizations using the software,

as well as other ways to create additional graphs within PowerPoint.

In any job or project, it’s likely that I’ll hit a stumbling point. It doesn’t help anyone to repeatedly try something that isn’t working. My goal is to work on becoming more flexible, so that when one approach doesn’t work, I can always step back, analyze the situation, and figure out a different approach that WILL work.
And possibly take a class on NVivo if I ever need to use it again.